Socio-Grid Co-simulation (SOCO) Example
This example uses GridLAB-D, HELICS, and a custom Python agent to produce metrics for a community resilience hub, including energy equity and environmental justice (EEEJ) factors. It provides a starting point for sprint studies that include EEEJ factors. Summary of Results
Steps to run simulations
This example has been tested on Ubuntu, not Windows.
Need
pip3 install tesp_support, and Helicspython3 prepare_case.pyto make a weather file, and GridLAB-D metrics dictionary./testglm.shto run a time-series power flow, without eventspython3 plots.pyto summarize and plot metrics./run.shto run a HELICS federation that simulates a utility outage after 2 dayspython3 plots.pyagain to summarize and plot metrics
The SOCO agent is in soco.py, configured in socoConfig.json:
Opens the utility switch after 2 days
During the event, controls battery discharging and charging
During the event, dispatches the diesel generator as a swing machine
At the event start, suppresses some of the non-critical load in homes (Because of the internal GridLAB-D schedule implementation, these messages have to be sent repeatedly. In TESP, schedules are implemented in the agents to avoid repeated messages, which are very inefficient. An alternative might be to shed load components by opening switches, which would have to be added to soco_test.glm)
The Diesel Generator (DG) is 600 kW, 650 kVA, $0.5/kwh, 2.3 lbs CO2/kwh, 0.221 lbs PM/kwh
Results
The following scenarios compare metrics based on 7-day simulations. In the first “blue sky” case, the utility source is not interrupted. In the remaining five cases, the utility source interrupts two days into the simulation.
The tabulated results include:
Total electric bill for the week, in dollars
- Columns for each meter location:
Electric bill, in dollars
Energy delivered, in kwh
Maximum voltage, in percent
Minimum voltage, in percent
Hours out of service
Hours below the ANSI C84.1 B range, i.e., below 91.67% of normal voltage
Hours below the ANSI C84.1 A range, i.e., below 95.00% of normal voltage
Energy delivered to homes outside the Hub, during the 5 outage days, in kwh
Blue Sky Conditions
Includes utility source, minimal 10 W battery, 50 kW PV at full irradiance, DG not running.
The command ./testglm.sh runs this case without opening the utility switch.
 Power and Voltage - Blue Sky
 Hub Power - Blue Sky
Total meter bill = 271357.053
Meter Name         Bill     Energy    Vmax    Vmin HrsOut HrsBLO HrsALO
hub_mtr        11944.49   23876.99 96.2949 92.8285   0.00   0.00 117.01
homes_mtr_A    40425.25   80838.51 94.2323 88.1862   0.00 105.01 168.00
homes_mtr_B    41278.72   82545.45 95.1308 88.6606   0.00  40.06 161.08
homes_mtr_C    40544.66   81077.33 95.0448 88.0395   0.00  95.06 166.06
fdr_head      140930.25  281848.49 99.6419 99.1370   0.00   0.00   0.00
hub_bess_mtr       5.16      -1.68 96.3557 92.9486   0.00   0.00 116.95
hub_dg_mtr        -9.12     -30.24 96.3557 92.9486   0.00   0.00 116.95
hub_pv_mtr     -3762.37   -7536.73 96.3557 92.9486   0.00   0.00 116.95
Home kWH = 174626.54 over points 576 to 2016
Utility Outage; Non-Hub Refrigerators Off During Outage
Includes minimal 10 W battery, 50 kW PV, Refrigerators off during outage. It is assumed that loads outside the community resilience hub would be disconnected, as may be current practice.
 Power and Voltage - Refrigerators Off
 Hub Power - Refrigerators Off
Total meter bill = 79396.960
Meter Name         Bill     Energy    Vmax    Vmin HrsOut HrsBLO HrsALO
hub_mtr        11944.49   23877.23 96.1547 92.6807   0.00   0.00 153.01
homes_mtr_A    12020.00   24027.81 94.8976 88.0370   0.00  30.09 168.00
homes_mtr_B    12243.63   24475.34 95.0350 88.5269   0.00  14.60 167.51
homes_mtr_C    12061.98   24111.79 96.1569 87.8932   0.00  29.26  50.30
fdr_head       40704.87   81396.58 99.6265 94.6223   0.00   0.00 120.00
hub_bess_mtr       6.30       0.60 96.2157 92.8012   0.00   0.00 153.00
hub_dg_mtr     -8493.88  -16999.81 96.2157 92.8012   0.00   0.00 153.00
hub_pv_mtr     -1090.44   -2192.84 96.2157 92.8012   0.00   0.00 153.00
Home kWH = 2924.22 over points 576 to 2016
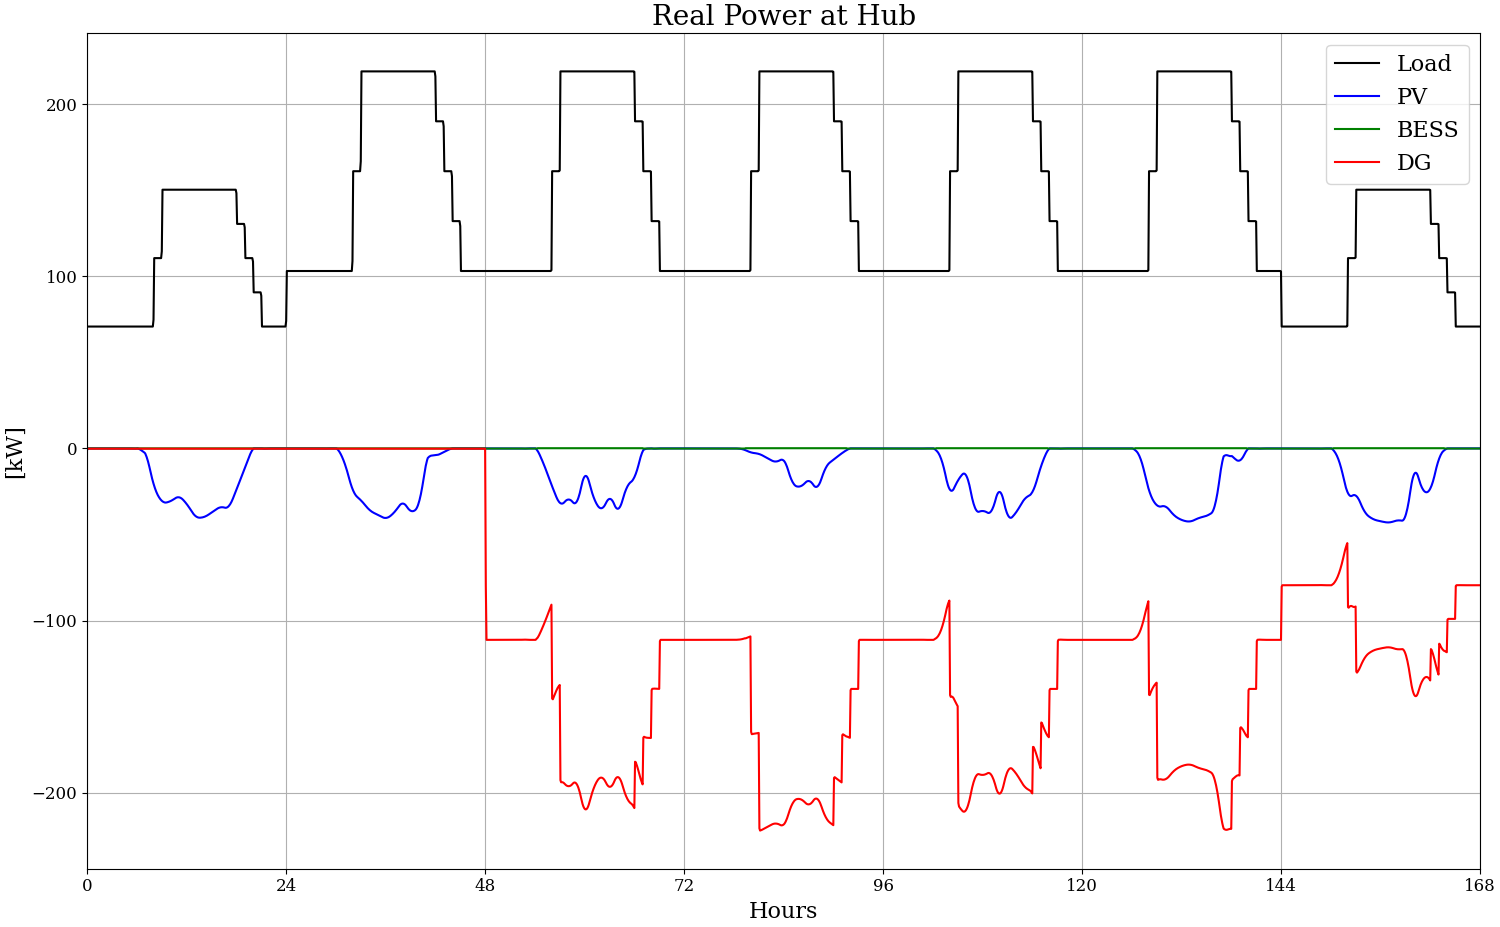
Utility Outage; Non-Hub Refrigerators On During Outage
Includes minimal 10 W battery, 50 kW PV, Refrigerators on during outage. It is assumed that community members would voluntarily turn off all electric loads outside of the hub, except for refrigerators.
 Power and Voltage - Refrigerators On
 Hub Power - Refrigerators On
Total meter bill = 84573.247
Meter Name         Bill     Energy    Vmax    Vmin HrsOut HrsBLO HrsALO
hub_mtr        11944.49   23877.23 96.1547 92.6807   0.00   0.00 153.01
homes_mtr_A    17062.16   34112.14 94.4943 88.0370   0.00  30.11 168.00
homes_mtr_B    17070.69   34129.45 95.0350 88.5269   0.00  15.03 167.51
homes_mtr_C    17238.02   34463.87 95.7500 87.8932   0.00  29.26  50.77
fdr_head       40704.87   81396.58 99.6265 94.6223   0.00   0.00 120.00
hub_bess_mtr       6.30       0.60 96.2157 92.8012   0.00   0.00 153.00
hub_dg_mtr    -18362.85  -36737.88 96.2157 92.8012   0.00   0.00 153.00
hub_pv_mtr     -1090.44   -2192.84 96.2157 92.8012   0.00   0.00 153.00
Home kWH = 33014.74 over points 576 to 2016
Increased Solar (Refrigerators On)
Includes a minimal 10 W battery, 500 kW PV, Refrigerators on during outage.
 Power and Voltage - Solar
 Hub Power - Solar
Total meter bill = 78249.405
Meter Name         Bill     Energy    Vmax    Vmin HrsOut HrsBLO HrsALO
hub_mtr        11944.49   23877.23 96.1577 92.6807   0.00   0.00 137.82
homes_mtr_A    17171.39   34330.58 94.4943 88.0371   0.00  15.03 168.00
homes_mtr_B    17162.95   34313.95 95.5117 88.5269   0.00  14.70 164.85
homes_mtr_C    17346.33   34680.49 95.7500 87.8932   0.00  13.10  50.77
fdr_head       37628.82   75244.75 99.6268 94.6223   0.00   0.00 120.00
hub_bess_mtr       6.79       1.57 96.2186 92.8012   0.00   0.00 136.83
hub_dg_mtr    -12053.00  -24118.18 96.2186 92.8012   0.00   0.00 136.83
hub_pv_mtr    -10958.36  -21928.40 96.2186 92.8012   0.00   0.00 136.83
Home kWH = 33014.74 over points 576 to 2016
Hybrid Solar plus Storage (Refrigerators On)
Includes 110 kW battery, 500 kW PV, Refrigerators on during outage.
 Power and Voltage - BESS
 Hub Power - BESS
Total meter bill = 78571.028
Meter Name         Bill     Energy    Vmax    Vmin HrsOut HrsBLO HrsALO
hub_mtr        11944.49   23877.23 96.1577 92.6807   0.00   0.00 137.82
homes_mtr_A    17171.39   34330.58 94.4943 88.0371   0.00  15.03 168.00
homes_mtr_B    17162.95   34313.95 95.5117 88.5269   0.00  14.70 164.85
homes_mtr_C    17346.33   34680.49 95.7500 87.8932   0.00  13.10  50.77
fdr_head       37628.82   75244.75 99.6268 94.6223   0.00   0.00 120.00
hub_bess_mtr      30.04      48.00 96.2186 92.8012   0.00   0.00 136.83
hub_dg_mtr    -11754.63  -23521.36 96.2186 92.8012   0.00   0.00 136.83
hub_pv_mtr    -10958.36  -21928.40 96.2186 92.8012   0.00   0.00 136.83
Home kWH = 33014.74 over points 576 to 2016
Hub-Only Case with Small Diesel Generator and Refrigerators Off
Includes a 110 kW battery, 500 kW PV, Refrigerators off during outage, smaller 30-kW DG. Although refrigerators outside the hub would lose service, this scenario shows how the community resiliance hub could be operated with a DG 20 times smaller than the existing DG.
 Power and Voltage - Hub Only
 Hub Power - Hub Only
Total meter bill = 73095.682
Meter Name         Bill     Energy    Vmax    Vmin HrsOut HrsBLO HrsALO
hub_mtr        11944.49   23877.23 96.1577 92.6807   0.00   0.00 137.82
homes_mtr_A    12129.22   24246.25 94.8976 88.0371   0.00  15.01 168.00
homes_mtr_B    12335.89   24659.84 95.5117 88.5269   0.00  14.27 164.85
homes_mtr_C    12170.29   24328.41 96.1569 87.8932   0.00  13.10  50.30
fdr_head       37628.82   75244.75 99.6268 94.6223   0.00   0.00 120.00
hub_bess_mtr    -749.86   -1511.77 96.2186 92.8012   0.00   0.00 136.83
hub_dg_mtr     -1404.82   -2821.64 96.2186 92.8012   0.00   0.00 136.83
hub_pv_mtr    -10958.36  -21928.40 96.2186 92.8012   0.00   0.00 136.83
Home kWH = 2924.22 over points 576 to 2016